Platforms, sometimes called internal developer platforms, are a unified infrastructure that allows all the development teams you have in your company, whether it be two or 20 or 100, to deliver applications rapidly and consistently. Some may think that Kubernetes itself is a platform, but Kubernetes itself is really a good starting point for building a platform. Raw Kubernetes, the Kubernetes API on its own, provides a lot of tools and options, but really it doesn't have all the safe defaults that you might want in place for deploying apps and services to production environments.
If Kubernetes is your foundation, then you need to start adding things onto that foundation to build a platform. In our recent Kubernetes Clinic series, we covered a lot of different things you need, including:
Our final clinic in this series explores cost management and reporting
(watch the webinar recording on demand).
Everyone understands the goal of cost optimization is not to spend more than you need to spend on your workloads. You want to be efficient in how you're deploying your workloads, how they run together, what resources you're using across the board to keep costs as low as possible. We used to use rack mounted servers and data centers, which had much more predictable costs. If you deployed a single binary, such as an app or a database engine, to a server, you could easily see what kind of resources that binary was using, and how that compared to what was available on your workload. In a Kubernetes cluster, that’s much more difficult because there are many more moving parts in a Kubernetes cluster.
In Kubernetes, a pod is here, then gone. A pod moves from node A to node B. How do you track what your utilization looks like for that workload when you've got all those moving pieces? When you add in autoscalers, like the cluster-autoscaler or horizontal pod autoscaler, the number of nodes and pods you have today could be different tomorrow or even in a couple of minutes. If you’re using a vertical pod autoscaler, then even the amount of resources the pods are using can change. There are a lot of moving parts in Kubernetes, which means it is hard to predict in terms of your cost.

There are some great open source tools that can help you understand what you’re spending on a cluster. Let’s take a look at two of them.
Kube-capacity is an open source command line interface (CLI) tool; it provides an overview of the resource requests, limits, and utilization in a Kubernetes cluster. If you run kube-capacity with no flags, it will give you an idea of how much of the available CPU and memory on a node is being requested by your workload. That's important, because the amount that you're requesting is what the kube scheduler is going to use to determine where to schedule your workload. Whatever you say you need, the kube scheduler is going to require that any node you put this workload on have at least that much available.
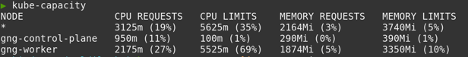
This output is from an example kind (Kubernetes in Docker) cluster.
If you pass in the –util flag, you can see two more columns: the CPU util and the memory util. Those tell you how much you’re using in your workload. Even in a little cluster, you can see the numbers are clearly higher than what you're using.

This output is from an example kind (Kubernetes in Docker) cluster.
This tool shows you the difference between what you're saying you need for your workload and what you're currently using for your workload. Too large of a skew here and your cluster could be over-provisioned, resulting in unnecessary costs. Kube-capacity can show you that your utilization is off and you need to make changes to your workload and resource requests. However, because pods expand and change, it can be difficult to figure out how to change your requests and limits over time.
Goldilocks can help you with this type of optimization. Goldilocks, an open source utility maintained by Fairwinds, helps you identify a starting point for resource requests and limits. It uses the Vertical Pod Autoscaler (VPA), which is another open source project. If you deploy the VPA to your cluster and turn everything on, it'll make recommendations and dynamically change your workloads to match what it thinks your resource request and limits should be. This can be a little dangerous, especially if you're just starting out with Kubernetes.
Goldilocks uses the recommender portion of the Vertical Pod Autoscaler and creates VPAs for every workload deployed within a namespace with the goldilocks.fairwinds.com/enabled=true label (or use the --on-by-default flag to enable Goldilocks for all namespaces), then presents that information for you in a dashboard so that you can decide about where those resource requests and limits should fall based on your knowledge of your application.
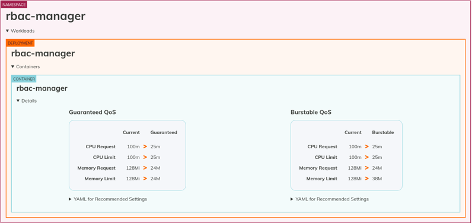
This screenshot is from Goldilocks which shows output from an example kind (Kubernetes in Docker) cluster.
Over time, it will show you recommendations. For the recommender, Goldilocks can pull metrics from either Prometheus or Metrics Server. We recommend Prometheus because it provides more accurate results.
Goldilocks provides two separate ways to set requests and limits for this workload. There's a guaranteed Quality of Service (QOS) and a burstable QOS. Kubernetes uses QOS to help make decisions about scheduling and evicting pods from nodes. Guaranteed QOS means that it will not evict those pods from a node. To get that set, you set the requests and limits to be the same value. Burstable QOS means that it will let it go above the amount that you've requested to a certain point, and that's what the limit is used for.
The way that you get costs under control is to use your available resources more efficiently. If you set your resources correctly, you can bin pack all those things into the right spot.
But you also need a way to correlate that to actual cost. How much does CPU cost me? How much does memory cost? And how do you show over time that you’re improving cost by improving efficiency?
Goldilocks allows you to add cost estimates. You need to fill out the API token, which should be sent to you via email, and then you can select a cloud provider: Amazon Web Services (AWS), Google Cloud Platform (GCP), or Other. If you're on-prem or you don't want to use the data from AWS, you can also select Other, and enter the dollars per CPU hour and dollars per gigabyte hours.
Once you hit save, you’ll start to see more information in the Goldilocks dashboard. After a bit, you can see how much an application is costing you and you can also see what the recommendation will do for you. If you change to the recommended values, you may be able to drop the cost of an application. Goldilocks adds context that anyone can understand by providing a dollar value.
If you want to use historical information, be able to show cost per workload in a graph, export data, and analyze cost over time, you can use Fairwinds Insights. Fairwinds Insights has a free tier available; you can use it in up to two clusters for free and all the features in the Insights platform are available in the free tier. The Efficiency tab in Insights allows you to filter to a specific cluster and learn how much that cluster has been costing for the last 30 days. It also shows the CPU limits, the CPU requests, and the utilization number you saw in kube-capacity for the whole cluster. You can also look at memory capacity and utilization number as well as a historical view of your capacity.
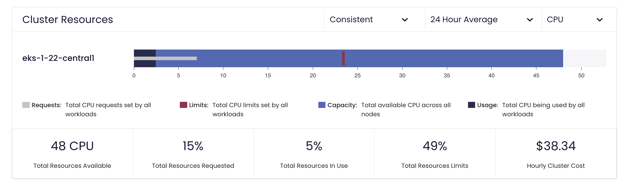
This image shows cluster resource use in Fairwinds Insights using an example cluster.
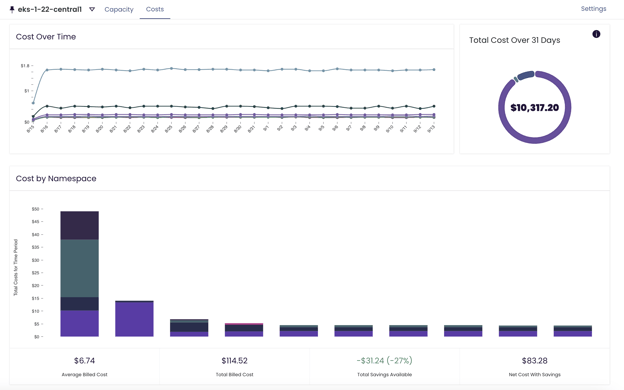
This image shows the cost over time in the Fairwinds Insights Efficiency page using an example cluster. The new cost page pulls data from Prometheus only.
Insights syncs Prometheus data and AWS costs, which allows you to see the cost of a cluster accurately to the cent. It also shows you your most expensive workloads, idle costs, how much memory and CPU were billed, how much it cost over a chosen period of time, and a historical representation of your costs.
If you’re building a Kubernetes platform, make sure it provides the cost management and reporting information you need to communicate clearly about how you are optimizing Kubernetes spending while ensuring your applications are reliable and scalable.