I’m excited to introduce Polaris, an open source project that helps keep your Kubernetes clusters healthy. We designed Polaris to automate some of the best practices we’ve used at Fairwinds to run clusters securely and reliably for a wide variety of customers. Today we’re open sourcing it.
We’ve seen time after time that seemingly small missteps in deployment configuration can lead to much bigger issues that end up waking you up at night. Something as simple as forgetting to configure resource requests could break autoscaling or even cause your workloads to run out of resources. Small configuration issues like this have led to production outages in the past — now they’re entirely preventable with Polaris.
Polaris can help you avoid configuration issues that affect the stability, reliability, scalability, and security of your applications. It provides a simple way to identify shortcomings in your deployment configuration and prevent future issues. With Polaris, you can sleep soundly knowing that your applications are deployed with a set of well tested standards.
A dashboard that provides an overview of how well current deployments are configured within a cluster.
An experimental validating webhook that can prevent any future deployments that do not live up to a configured standard.
Run Polaris in multiple clusters, track results over time and integrate with Slack, Datadog, and Jira with Fairwinds Insights, software to standardize and enforce development best practices. It's free to use! Compare Polaris and Insights.
We developed the Polaris dashboard as a way to get a simple visual overview of the current state of your Kubernetes deployments as well as a roadmap for what can be improved. The dashboard provides a cluster wide overview as well as breaking out results by category, namespace, and deployment.
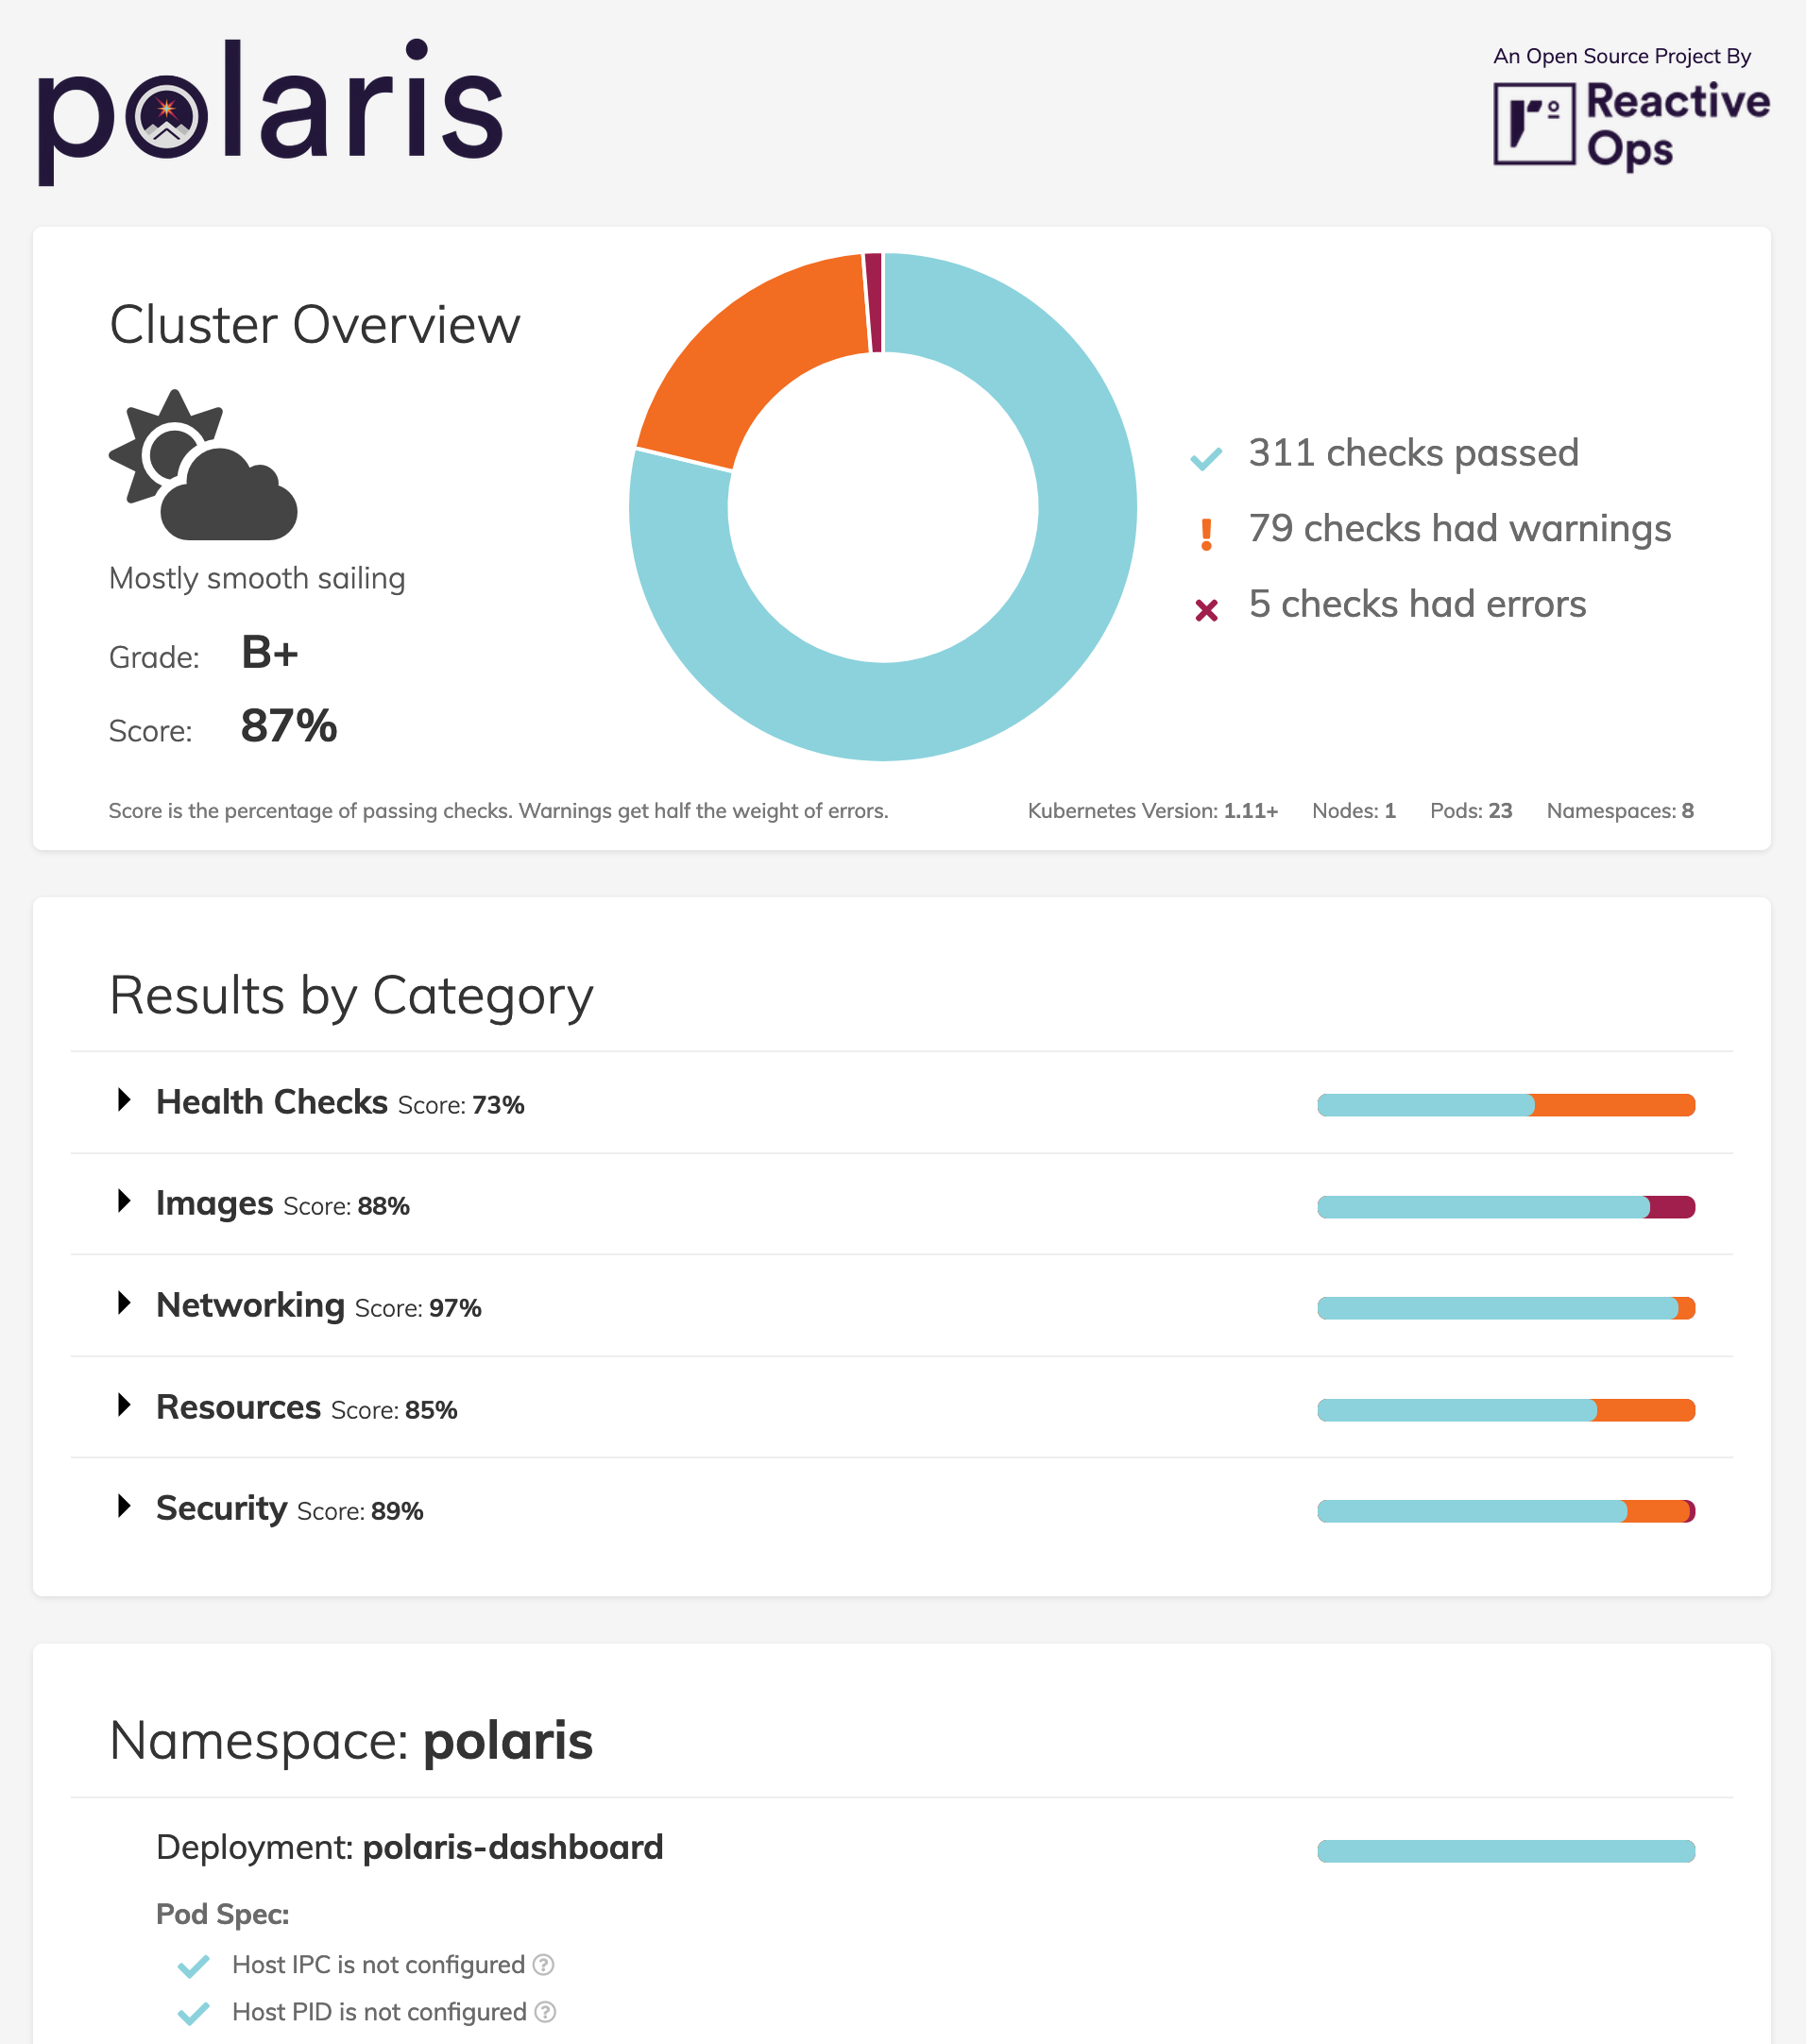
Our default standards in Polaris are rather high, so don’t be surprised if your score is lower than you might expect. A key goal for Polaris was to set a high standard and aim for great configuration by default. If the defaults we’ve included are too strict, it’s easy to adjust the configuration as part of the deployment configuration to better suit your workloads.
As part of releasing Polaris, we’ve decided not just to release the tool, but also thorough documentation for the checks we’ve chosen to include. Each check includes a link to corresponding documentation that explains why we think it is important, with links to further resources around the topic.
While the dashboard provides an overview of the state of your current deployment configuration, the webhook component provides a way to enforce a higher standard for all future deployments to your cluster.
Once you’ve had a chance to address any issues identified by the dashboard, you can deploy the Polaris webhook to ensure that configuration never slips below that standard again. When deployed in your cluster, the webhook will prevent any deployments that have any “error” level configuration violations.
Although we’re very excited about the potential for this webhook, we’re still working on more thorough testing before we’re ready to consider it production ready. This is still an experimental feature and part of a brand new open source project. Because it does have the potential to prevent updates to your deployments, use it with caution.
Hopefully if you’ve made it this far, Polaris is a tool that could be useful for you. It’s easy to deploy the dashboard into your cluster if you’d like to see the results for yourself. This is deployed with minimal, read only permissions, and all the data stays with you. To deploy the dashboard with kubectl, run:
kubectl apply -f
https://raw.githubusercontent.com/fairwindsops/polaris/master/deploy/dashboard.yaml
From there, you can use port forwarding to access the dashboard locally on port 8080:
kubectl port-forward --namespace polaris svc/polaris-dashboard 8080:80Of course there are many other ways to use or deploy Polaris, including with Helm. For that and a whole lot more information, view the Polaris repo on Github.
We’re excited about what we’ve already built into Polaris, but there’s a lot more to come. We have a variety of new checks we’d like to add to expand the scope of Polaris, and we’re also working to find the best way to provide namespace or resource level exceptions to our validation rules. For more information on what we’ll be working on, check out our roadmap inside the Polaris repo on Github.
If Polaris sounds like something that could be useful for you, please take some time to give it a try. Whether it’s questions, feedback, ideas, or pull requests, we’d love to hear from you. Start the conversation here, on Github, or on Twitter.